Lake Erie Beaches Ranked: 48,954 Water Tests, 19 Seasons
We pulled 48,954 state water tests from 85 Lake Erie beaches across 19 seasons and ranked every one of them. The gap between the best and worst beach is huge, and the clean end is not where you would guess.
What we did
Most "is Lake Erie clean" coverage runs on a single summer's advisory headlines, which is how a beach that had a bad July gets a permanent reputation and a beach that quietly fails half its tests never gets a mention. So we went to the primary data instead.
The Ohio Department of Health samples its bathing beaches for E. coli through the summer and reports every result to the EPA's Water Quality Exchange. We pulled the whole record (48,954 samples from 85 Lake Erie beaches across 19 seasons, 2006 to 2025) and counted how often each beach came back over Ohio's 235 cfu/100mL limit, the level at which the state posts a bacteria contamination advisory.
That gives every beach a track record rather than an anecdote. The whole table below regenerates from the state's own data each winter, so nothing on this page is a number we typed and forgot.
The beaches you are actually choosing between
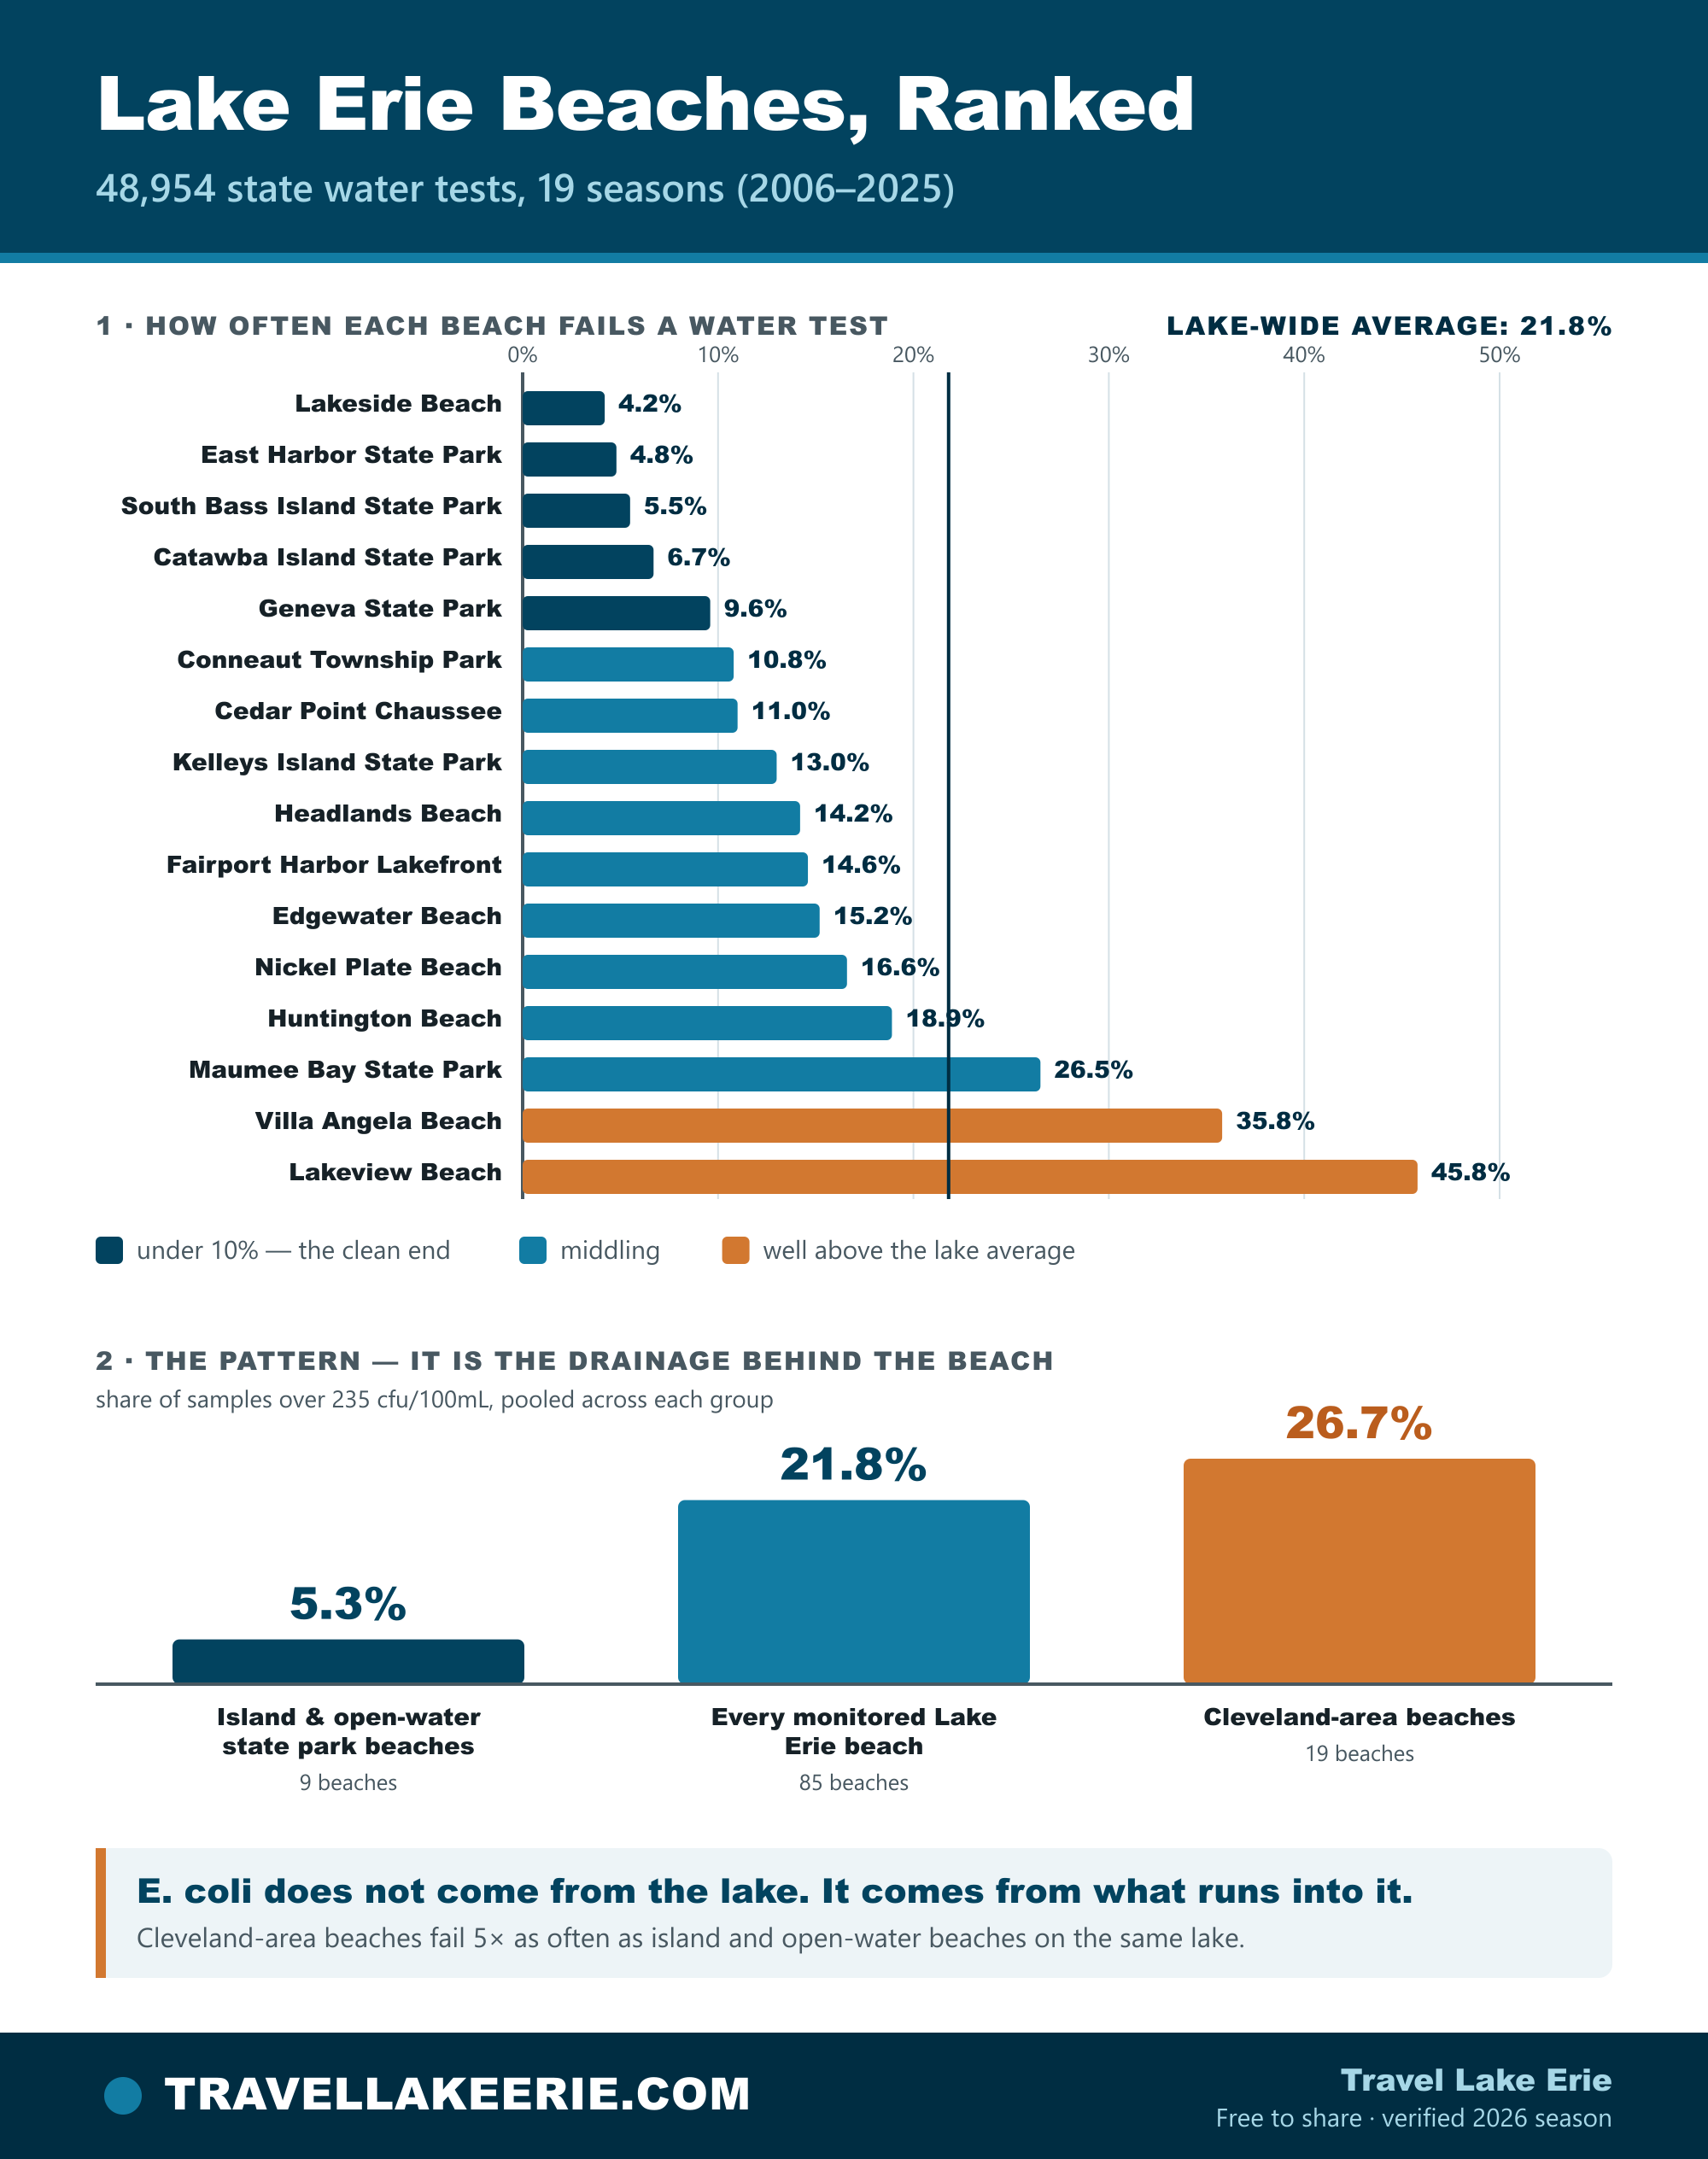
We rank them cleanest first, by the share of samples over the limit. "Rank" is out of the 59 Lake Erie beaches with enough sampling for a percentage to mean anything:
| Beach | Where | Samples over the limit | Rank |
|---|---|---|---|
| Lakeside Beach | Lakeside | 4.2% | 2 / 59 |
| East Harbor State Park | Marblehead peninsula | 4.8% | 3 / 59 |
| South Bass Island State Park | Put-in-Bay | 5.5% | 4 / 59 |
| Catawba Island State Park | Catawba | 6.7% | 5 / 59 |
| Geneva State Park | Geneva-on-the-Lake | 9.6% | 7 / 59 |
| Conneaut Township Park | Conneaut | 10.8% | 10 / 59 |
| Cedar Point Chaussee | Sandusky | 11.0% | 11 / 59 |
| Kelleys Island State Park | Kelleys Island | 13.0% | 12 / 59 |
| Headlands Beach | Mentor | 14.2% | 15 / 59 |
| Fairport Harbor Lakefront | Fairport Harbor | 14.6% | 17 / 59 |
| Edgewater Beach | Cleveland | 15.2% | 20 / 59 |
| Nickel Plate Beach | Huron | 16.6% | 26 / 59 |
| Huntington Beach | Bay Village | 18.9% | 28 / 59 |
| Maumee Bay State Park | Toledo | 26.5% | 37 / 59 |
| Villa Angela Beach | Cleveland | 35.8% | 52 / 59 |
| Lakeview Beach | Lorain | 45.8% | 58 / 59 |
Based on 48,954 Ohio Department of Health samples, 2006–2025. This is track record, not today's status. Any beach here can draw an advisory after a heavy rain and clear again two days later.
Blame the drainage, not the lake
Read the table from the top and the geography does all the work. The clean end is islands, exposed points and sheltered state parks. The dirty end is city beaches and small municipal strands with a storm sewer network behind them.
| Group | Beaches | Samples | Over the limit |
|---|---|---|---|
| Island & open-water state park beaches | 9 | 3,565 | 5.3% |
| Every monitored Lake Erie beach | 85 | 48,954 | 21.8% |
| Cleveland-area beaches | 19 | 12,033 | 26.7% |
That is a 5-fold gap between the two ends of the same lake. E. coli comes from what runs into the lake, not from the open water. A beach with a city and a combined sewer system behind it will draw advisories after storms no matter how clear the water looks. A beach with two miles of open water behind it usually will not.
Which is why the popular mental model is upside down. Because algae gets the national coverage, people assume the western basin and the islands are the dirty end and Cleveland is the clean end. On bacteria (the thing that closes beaches, lake-wide, all season), it is close to the reverse. Villa Angela Beach fails 35.8% of its tests. South Bass Island State Park fails 5.5%.
The clean beaches are on the islands
South Bass and the Marblehead peninsula hold the top of this table, and they are all a ferry ride or a short drive from the same handful of towns. Lock lodging in first. The good-water weekends are the ones everyone else books too.
Check Put-in-Bay hotel pricesTwo different problems, opposite rules
Almost every summary blurs these two together. Algae and bacteria are unrelated, and they do not respond to the same decision:
| Harmful algal bloom | Bacteria (E. coli) advisory | |
|---|---|---|
| What it is | Cyanobacteria that can produce microcystin, a liver toxin | Fecal bacteria from runoff and sewer overflows |
| Where | Western basin only, from Maumee Bay east toward the islands | Anywhere on the lake; worst at urban beaches |
| Driven by | Spring phosphorus loading, then sun and calm water | Heavy rain in the previous 24 to 48 hours |
| When | Mid-July through September, peaking in August | Any time the beach is open, all season |
| Can you see it? | Yes, green paint-like streaks and surface mats | No. Water can look perfect and still carry an advisory |
| The one rule | If you can see scum, do not swim in it | Give it 48 hours after a big rain |
They barely overlap geographically. A Cleveland beach does not get the algae bloom, because it is in a different basin. An island beach never has a combined-sewer problem, because it has no combined sewers. The ranking above measures bacteria, because that is the one that applies to the whole lake all season. For the western basin bloom, see our 2026 algae bloom forecast.
The 48-hour rain rule
Elevated E. coli almost always follows a significant wet-weather event: rain flushes bird and animal waste off pavement and lawns, and in older cities it overwhelms combined sewer systems that carry sewage and stormwater in the same pipe and overflow by design into the nearest water body when they fill. High lake levels and a strong west wind make it worse by pinning that water against the shore.
Skip the sunshine forecast. The useful pre-trip check is:
- Did it rain hard in the last 48 hours? If yes, expect postings, and lean harder on the top of the table, where there is no drainage network to flush.
- Is the wind out of the west and blowing hard? That holds runoff against the shore in the east and can push bloom material toward the islands in the west.
- Look up the actual beach on BeachGuard the morning you go. A sample from a different beach ten miles away tells you nothing.
An advisory is a warning, not a closure. It means the sample exceeded 235 colony-forming units per 100 mL, and that children, older adults, and anyone ill or immunocompromised should stay out of the water. The posting stays up until a follow-up sample comes back under the standard.
Is the lake getting cleaner?
Not on this measure, and not dirtier either. Across 19 seasons the lake-wide exceedance rate has bounced between 15.4% in 2020 and 31.8% in 2013, starting at 19.0% in 2006 and landing at 23.3% in 2025. The swings track how wet each summer was far more than anything happening in the lake itself.
Which is worth knowing mostly as a defence against headlines. A bad July does not mean the lake is deteriorating, and a clean August does not mean it has recovered. The beach-level differences in the table above are far larger and far more stable than the year-to-year noise.
Where to check before you drive
- ODH BeachGuard: Official beach-by-beach sample results and advisory postings for the whole Ohio shoreline. The one that answers "does my beach have an advisory today."
- The Ohio Nowcast: In use at Edgewater and Villa Angela, it predicts the day's water quality from recent rainfall, wind direction and lake conditions rather than waiting on a lab result. Useful precisely because a sample result can already be a day stale.
- NOAA Lake Erie HAB Bulletin: Satellite imagery of where the algae bloom is, plus a 96-hour position forecast, through the July-to-October season. Only relevant west of roughly Sandusky.
- National Weather Service swim forecast: The daily low, moderate or high swim-risk outlook for Lake Erie beaches. It is separate from bacteria testing: high waves and currents can make otherwise clean water unsafe. Check the NWS beach and nearshore forecast on the morning you go. Edgewater and Villa Angela sit in nearshore zone LEZ146; our Lake Erie wave forecast guide explains how to read the wave line.
If BeachGuard is clear for your beach, the swim-risk outlook is low, and it has not poured in two days, get in the water.
Best time to go if the water is the point
Mid-June through early July is warm enough to swim, ahead of the bloom, and ahead of the worst of the advisory season. Late July and August is when both problems peak at once, and it is when most people go.
Regulars go in the first half of September, with the water still warm, bloom receding, crowds gone, and island room rates falling off a cliff after Labor Day. It is the best swimming fortnight of the Lake Erie year and almost nobody uses it.
Plan around the water, not the headlines
A posted beach is a one-day problem. A sold-out island is a whole-trip problem. Browse Put-in-Bay hotels, compare Kelleys Island, read the 2026 algae bloom forecast for the western basin picture, and book the ferry once your dates are set.
Check Put-in-Bay hotel pricesLake Erie beaches FAQ
Is it safe to swim in Lake Erie?
Usually, but it depends far more on which beach than on which lake. Across 19 seasons of Ohio Department of Health testing (48,954 samples at 85 beaches), 21.8% of all samples came back over Ohio's 235 cfu/100mL limit. But that lake-wide average hides a huge spread: the island and open-water state park beaches fail 5.3% of the time, while the Cleveland-area shoreline fails 26.7% of the time. Pick the right beach and the risk is small; the lake-wide number is not the number that applies to you.
Which Lake Erie beach has the cleanest water?
Of the 59 beaches with enough sampling to rank, Battery Park comes out cleanest at 3.4% of samples over the limit, followed by Lakeside Beach (4.2%) and East Harbor State Park (4.8%). The pattern is consistent: beaches on islands, exposed points and sheltered state parks with no urban drainage behind them dominate the clean end of the table.
Which Lake Erie beach has the worst water quality?
Edson Creek has the worst record of any well-sampled Lake Erie beach, failing 49.1% of its tests, roughly 9 times the island-beach rate. Lakeview Beach (45.8%) and Bay View West (44.4%) are close behind. Small city beaches and stream-mouth sites cluster at this end; none of them are the beaches most visitors are choosing between.
What is the difference between an algae advisory and a bacteria advisory?
They are two unrelated problems that people constantly conflate. A harmful algal bloom is cyanobacteria feeding on phosphorus out of the Maumee River, so it lives in the far western basin, peaks in August, and moves with the wind. You can usually see it. A bacteria contamination advisory is E. coli from stormwater runoff, combined sewer overflows and bird and animal waste, so it can hit any beach on the lake, spikes within a day or two of heavy rain, and is completely invisible. The algae rule is "look at the water." The E. coli rule is "look at the last 48 hours of rain."
Why do Lake Erie beaches close after it rains?
Because rain is what moves bacteria into the lake. Heavy rainfall flushes animal and bird waste off pavement, lawns and storm drains, and in older cities it overwhelms combined sewer systems that carry sewage and stormwater in the same pipe and overflow by design into the nearest water body when they fill. High lake levels and a strong west wind make it worse by keeping that water pinned against the shore. That is why the urban beaches rank where they do. The bacteria come from the drainage behind the beach.
Are the beaches at Put-in-Bay and Kelleys Island clean?
South Bass Island State Park at Put-in-Bay is one of the cleanest beaches on the lake, at 5.5% of samples over the limit. Kelleys Island State Park is more middling than its reputation suggests at 13.0%, which is still well under the lake-wide 21.8% but is roughly double South Bass. Both are small beaches; neither is a long stretch of sand in the Lake Michigan sense. Kelleys is the shallower and better of the two for young kids, South Bass the better bet on water quality.
Is Lake Erie water quality getting better or worse?
Neither, on this measure. Across 19 seasons the lake-wide exceedance rate has bounced between 15.4% (2020) and 31.8% (2013) with no direction to it. 2006 came in at 19.0% and 2025 at 23.3%. Year-to-year swings track summer rainfall far more than any change in the lake itself. Anyone claiming a clear trend in either direction is reading noise.
Did the July 2026 flooding affect Lake Erie beaches?
On July 6, 2026, Kelleys Island took roughly 13 to 17 inches of rain overnight, about four months of rain in under half a day and an unofficial all-time record for the island. Roads flooded, basements filled, and the village asked residents to conserve water. That is the runoff mechanism that drives bacteria advisories, and the days immediately after heavy rain are when postings cluster along the shore. You do not need to skip the lake. Give it a day or two after a big rain.
Is there an algae bloom on Lake Erie in 2026?
Yes. NOAA forecast a moderate 2026 bloom (3.5 on the severity index, with a likely range of 3 to 4.5). Its August 28 bulletin estimated the observed bloom at about 380 square miles, with the highest concentrations around Maumee Bay and patches as far east as Sandusky and the islands. For western-basin beach plans, check the live NOAA bulletin, and do not rely on a seasonal forecast or a beach’s historical bacteria record when you can see bloom material.
Can I bring a dog to a Lake Erie beach?
At many beaches yes, but water quality matters more for dogs than it does for people. Dogs drink lake water and then lick it out of their coats, which is why nearly every serious harmful-algae incident on Lake Erie involves a dog rather than a swimmer. Keep dogs out of visible scum entirely, rinse them off after a swim anywhere in the western basin in August, and check the individual park’s rules, since some state park beaches restrict pets to designated sections.
How do I check a Lake Erie beach before I go?
Three free sources, in order of usefulness for a specific beach on a specific day. The Ohio Department of Health’s BeachGuard posts beach-by-beach sample results and any active advisory. That is the one that answers "does my beach have an advisory today." The Ohio Nowcast, in use at Edgewater and Villa Angela, predicts the day’s water quality from rainfall, wind and lake conditions rather than waiting for a lab result. And NOAA’s Lake Erie HAB Bulletin shows where the algae bloom sits, with a 96-hour position forecast, through the July-to-October season.
When is the best time of year to swim in Lake Erie?
Mid-June through early July, or the first half of September. June is warm enough to swim, ahead of the bloom, and ahead of the peak advisory stretch. Late July and August are when the algae bloom intensifies and when bacteria advisories cluster. September is underrated. The water is still warm, the bloom is receding, the crowds are gone, and island lodging rates fall off a cliff after Labor Day.
We computed water quality figures from 48,954 Escherichia coli samples that the Ohio Department of Health bathing beach monitoring program reported to the EPA/USGS Water Quality Portal, covering 85 Lake Erie beaches over 19 seasons (2006–2025; the program did not report 2008). A sample exceeds at >235 cfu/100mL, Ohio's single-sample recreational standard. Rankings cover the 59 beaches with at least 250 samples. Because states report after each season closes, the rankings leave out the current summer. These are track records, and today's conditions are always a BeachGuard lookup. Bloom severity forecast from NOAA's National Centers for Coastal Ocean Science, June 25, 2026. Kelleys Island rainfall totals from National Weather Service reporting on the July 6, 2026 event.